Throughout the course of my career, an ability to communicate graphically through illustration, vector and raster renderings, and graphic design has held a principal role in my work. The ability to visually communicate ideas effectively is a critical component in the field of GIS. It is also an increasingly more common form of communicating complex ideas.

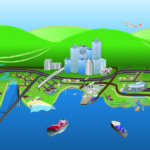
An illustration of example landscapes and uses along the San Francisco Bay shoreline – original size (8000×6000 px) provided for detailed exploration.
An illustration of example landscapes and uses along the San Francisco Bay shoreline – original size (8000×6000 px) provided for detailed exploration.

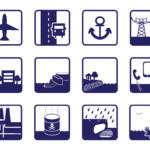
A series of icons developed to visually illustrate different asset categories of the Adapting to Rising Tides Project
A series of icons developed to visually illustrate different asset categories of the Adapting to Rising Tides Project
Animated GIFs
The passage of time and its effects on the environment is a difficult phenomena to display in a graphic. This series of animated GIFs was created to communicate the passage of time and the effect that Sea Level Rise can have on built and natural environments.


